Close Menu
Meteorological Technology International
  • News
    • A-E
      • Agriculture
      • Automated Weather Stations
      • Aviation
      • Climate Measurement
      • Data
      • Developing Countries
      • Digital Applications
      • Early Warning Systems
      • Extreme Weather
    • G-P
      • Hydrology
      • Lidar
      • Lightning Detection
      • New Appointments
      • Nowcasting
      • Numerical Weather Prediction
      • Polar Weather
    • R-S
      • Radar
      • Rainfall
      • Remote Sensing
      • Renewable Energy
      • Satellites
      • Solar
      • Space Weather
      • Supercomputers
    • T-Z
      • Training
      • Transport
      • Weather Instruments
      • Wind
      • World Meteorological Organization
      • Meteorological Technology World Expo
  • Features
  • Online Magazines
    • January 2026
    • April 2025
    • January 2025
    • September 2024
    • April 2024
    • Archive Issues
    • Subscribe Free!
  • Opinion
  • Videos
  • Supplier Spotlight
  • Expo
LinkedIn X (Twitter) Facebook
  • Sign-up for Free Weekly E-Newsletter
  • Meet the Editors
  • Contact Us
  • Media Pack
LinkedIn Facebook
Subscribe
Meteorological Technology International
  • News
      • Agriculture
      • Automated Weather Stations
      • Aviation
      • Climate Measurement
      • Data
      • Developing Countries
      • Digital Applications
      • Early Warning Systems
      • Extreme Weather
      • Hydrology
      • Lidar
      • Lightning Detection
      • New Appointments
      • Nowcasting
      • Numerical Weather Prediction
      • Polar Weather
      • Radar
      • Rainfall
      • Remote Sensing
      • Renewable Energy
      • Satellites
      • Solar
      • Space Weather
      • Supercomputers
      • Training
      • Transport
      • Weather Instruments
      • Wind
      • World Meteorological Organization
      • Meteorological Technology World Expo
  • Features
  • Online Magazines
    1. January 2026
    2. September 2025
    3. April 2025
    4. January 2025
    5. September 2024
    6. April 2024
    7. January 2024
    8. September 2023
    9. April 2023
    10. Archive Issues
    11. Subscribe Free!
    Featured
    November 27, 2025

    In this Issue – January 2026

    By Hazel KingNovember 27, 2025
    Recent

    In this Issue – January 2026

    November 27, 2025

    In this Issue – September 2025

    August 11, 2025

    In this Issue – April 2025

    April 15, 2025
  • Opinion
  • Videos
  • Supplier Spotlight
  • Expo
Facebook LinkedIn
Subscribe
Meteorological Technology International
Extreme Weather

NOAA expands flood inundation mapping services to 30% of US population

Elizabeth BakerBy Elizabeth BakerSeptember 26, 20243 Mins Read
Share LinkedIn Facebook Twitter Email
NOAA has expanded experimental flood inundation mapping (FIM) services from 10% to 30% of the US population.
Flood inundation mapping services are now implemented from the Northeast to Gulf Coast, in the Pacific Northwest and across Puerto Rico and the US Virgin Islands. Credit: NOAA’s Office of Water Prediction
Share
LinkedIn Facebook Twitter Email

NOAA has expanded experimental flood inundation mapping (FIM) services from 10% to 30% of the US population.

NOAA’s flood inundation mapping services

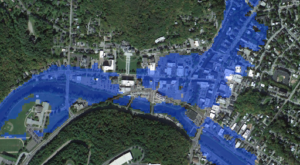
FIM provides near-real-time, high-resolution, street-level visualizations of flood waters and helps forecasters issue more accurate and timely flood watches and warnings. FIM also estimates where impacts may occur due to inundation of land areas as analyzed or predicted by the National Water Model and River Forecast Center streamflow simulations.

“Over the past year, FIM has been a game-changer in providing actionable and real-time information to emergency and water resource managers for flood impacts,” said David Vallee, director of service innovation and partnerships at NOAA’s National Water Center. “FIM expanding to 30% will allow us to provide more widespread and expansive impact-based decision support services to our core partners in flood-prone and vulnerable parts of the nation.”

In 2025, NWS will expand FIM services to 60% of the US population. In 2026, FIM will be fully deployed nationwide for 3.4 million river miles covered by National Water Model forecasts. NOAA’s experimental FIM and forecasting services are funded in part by the Bipartisan Infrastructure Law.

Increasing flood information access

FIM services now cover the Mid-Atlantic, the eastern Great Lakes, Ohio Valley, Lower Mississippi Valley, the central Gulf Coast region, the Pacific Northwest with all of Washington and parts of Oregon, and Puerto Rico and the US Virgin Islands. This includes the populated, metropolitan areas of Buffalo, Cincinnati, Indianapolis, Memphis, Nashville, New Orleans, Philadelphia, San Juan, Seattle, St Louis and Washington DC. NOAA launched FIM in autumn 2023, covering 10% of the country’s population in portions of Louisiana, New York, Pennsylvania and Texas.

Example of Flood Inundation Mapping Services over Montpelier, Vermont, along the Winooski River (including its North Branch) in July 2023. Credit: NOAA

FIM maps are available on the new National Water Prediction Service website and on a few Geographic Information System (GIS) applications. FIM Services for the lower 48 states include four map options – a National Water Model derived latest analysis, a five-day forecast derived from the National Water Model, a five-day forecast derived from NWS River Forecast Center streamflow predictions and a static categorical FIM (CatFIM) for selected NWS River forecast locations within the FIM domain.

FIM services for Puerto Rico and the US Virgin Islands will consist of a National Water Model derived latest analysis FIM and a 48-hour forecast based on National Water Model streamflow predictions.

In related news, the Bipartisan Infrastructure Law and Inflation Reduction Act recently awarded US$100m in funding to General Dynamics Information Technology for NOAA’s newest high-performance computer (HPC) system, called Rhea. Rhea will be used to advance research on weather, climate, ocean and ecosystem prediction. Click here to read the full story

Previous ArticleEXPO NEWS: Highlights from Day 2 at Meteorological Technology World Expo
Next Article National Oceanography Centre trials hydrotreated vegetable oil in two research ships

Read Similar Stories

Extreme Weather

AI model improves real-time prediction of wildfire spread

April 16, 20263 Mins Read
Climate Measurement

Study identifies atmospheric trigger behind flash droughts in Puerto Rico

April 15, 20263 Mins Read
Climate Measurement

Regional training aims to improve flood forecasting in Central Africa

April 1, 20263 Mins Read
Latest News

Northumbria University secures £4m to study Earth’s radiation belts

April 16, 2026

AI model improves real-time prediction of wildfire spread

April 16, 2026

Study identifies atmospheric trigger behind flash droughts in Puerto Rico

April 15, 2026

Receive breaking stories and features in your inbox each week, for free


Enter your email address:


Supplier Spotlights
  • Reuniwatt
Getting in Touch
  • Contact Us / Advertise
  • Meet the Editors
  • Media Pack
  • Free Weekly E-Newsletter
Our Social Channels
  • Facebook
  • LinkedIn
© 2026 UKi Media & Events a division of UKIP Media & Events Ltd
  • Cookie Policy
  • Privacy Policy
  • Terms and Conditions
  • Notice and Takedown Policy

Type above and press Enter to search. Press Esc to cancel.